Visualisations
Explore the DaveField through images, videos, and interactive graphics. Here you will find a small and growing selection of visualisations showing prime distributions,
lattice projections, field propagations, charts and graphs and other interesting outputs from our simulations. crystal-like structures that emerge from the conjecture.
The gallery grows as new field runs are completed. Each image links to a larger view.
JS100 Symmetry Breaking
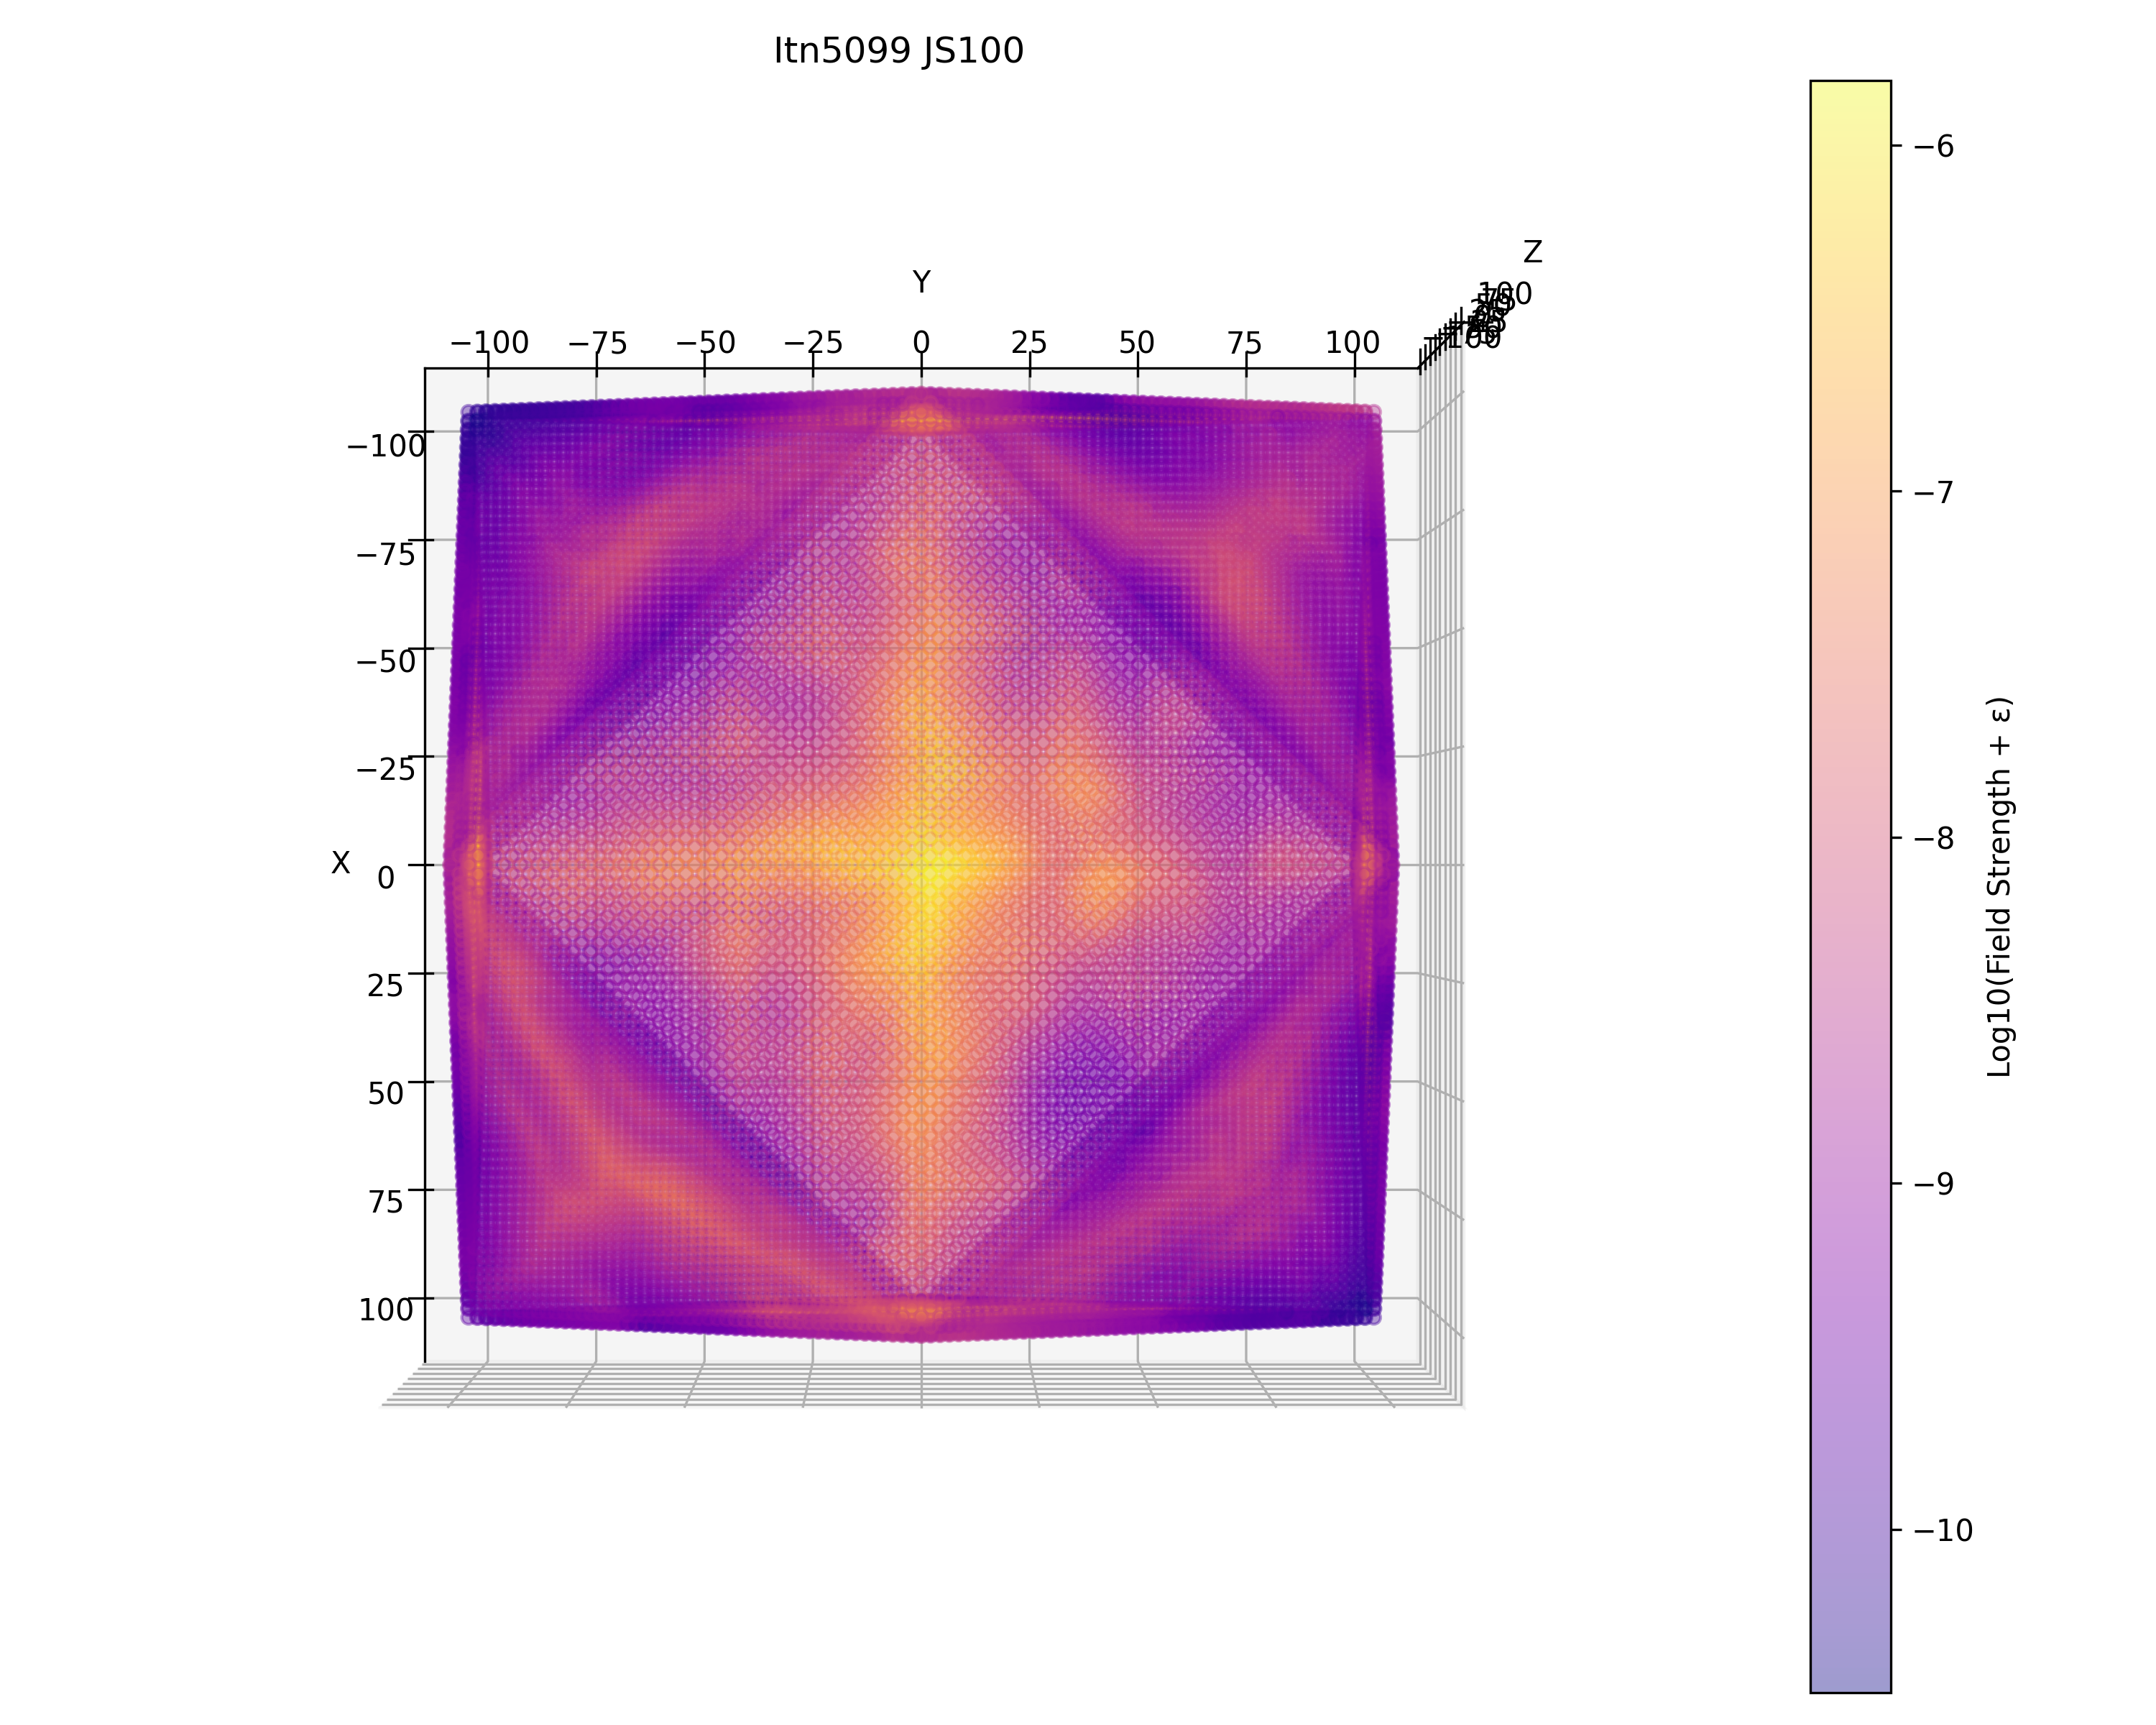
Itn5099 JS100 – Symmetry Breaking in a Propagating Field
This visualisation shows an early example of a mature "field" propagation, generated by implanting a single point of "data" or "potential" at the origin — a kind of numerical "Big Bang." The field then evolves under simple, perfectly symmetric rules. After 5,099 iterations, we see something remarkable: although the underlying rules are fully symmetric, the global structure of the field has developed broken symmetries. This illustrates a profound lesson: when mathematical ideals meet the realities of computation — in this case, floating-point precision under the IEEE 754 standard — subtle numerical effects accumulate. At the boundaries between exact symmetry and finite representation, new patterns emerge. This is more than just an artefact of computation: it hints at how complexity, asymmetry, and structure can arise naturally from simple laws, once they interact with the constraints of their environment.
Thermodynamic Surface of K Structure JS20
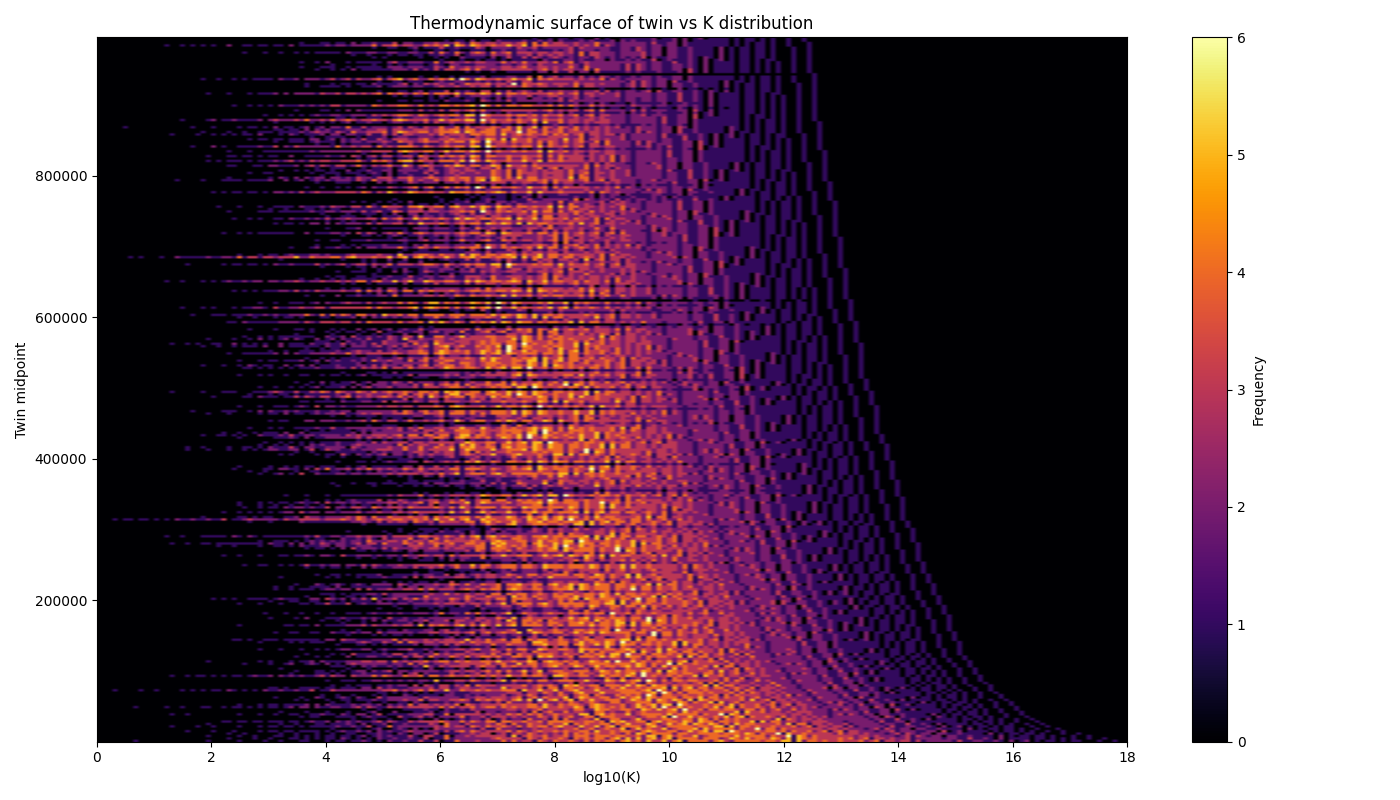
>Thermodynamic Surface of K Structure JS20
Here is a "thermodynamic" heat map of a twin prime field structure at "equilibrium". The coloured bands represent twin prime populations within the field. We can see clear vertical banding relating to allowed population densities with brighter colours showing the more densely populated classes. Horizontal striations relate to the specific allowed twin fingerprint of this particular field surface.
JS15 12V Full Field (Mollweide Projection)
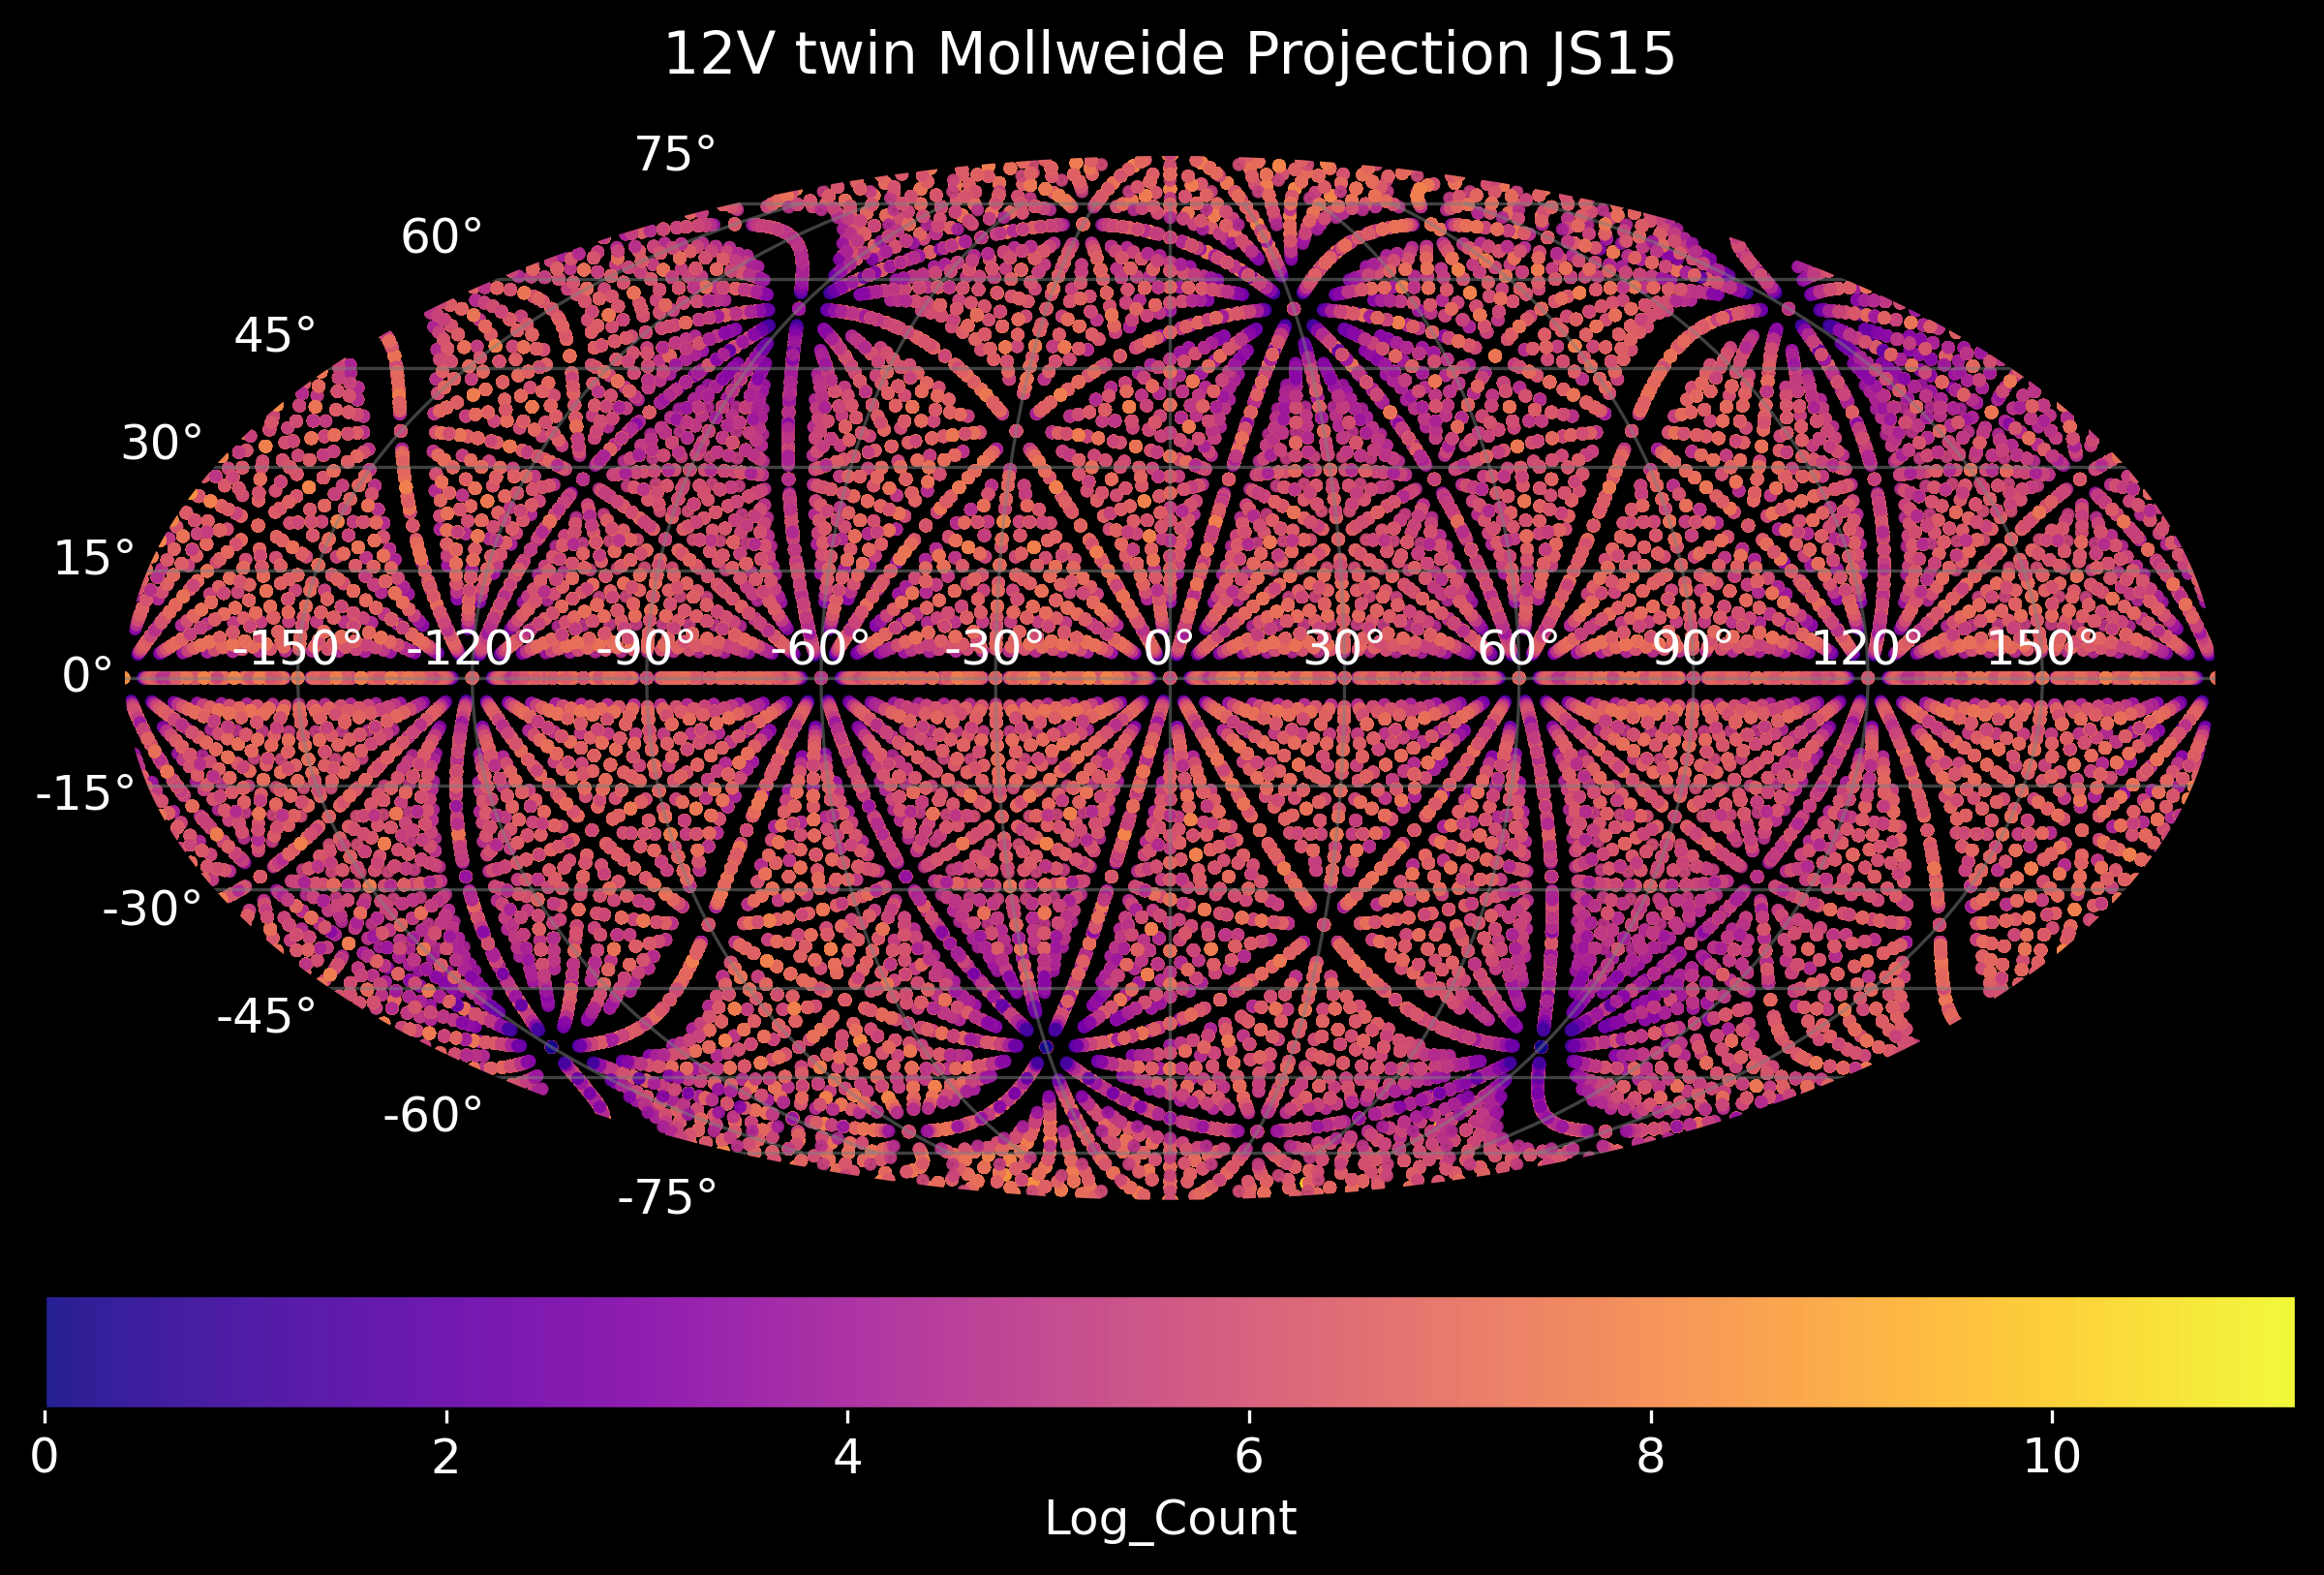
JS15 12V Full Field - "Starscape" of Twin Primes
An Image here of symmetrical patterns of twin primes creating a "starscape" of points in our full sky Mollweide plot. Each point represents a twin prime pair and brighter colours indicate higher integer figures - thousands of twin prime pairs all the way into the hundreds of billions crystallising an irreducible lattice of numbers in a field propagation.
Overlapping Histogram of K Values JS20 (Mollweide Projection)
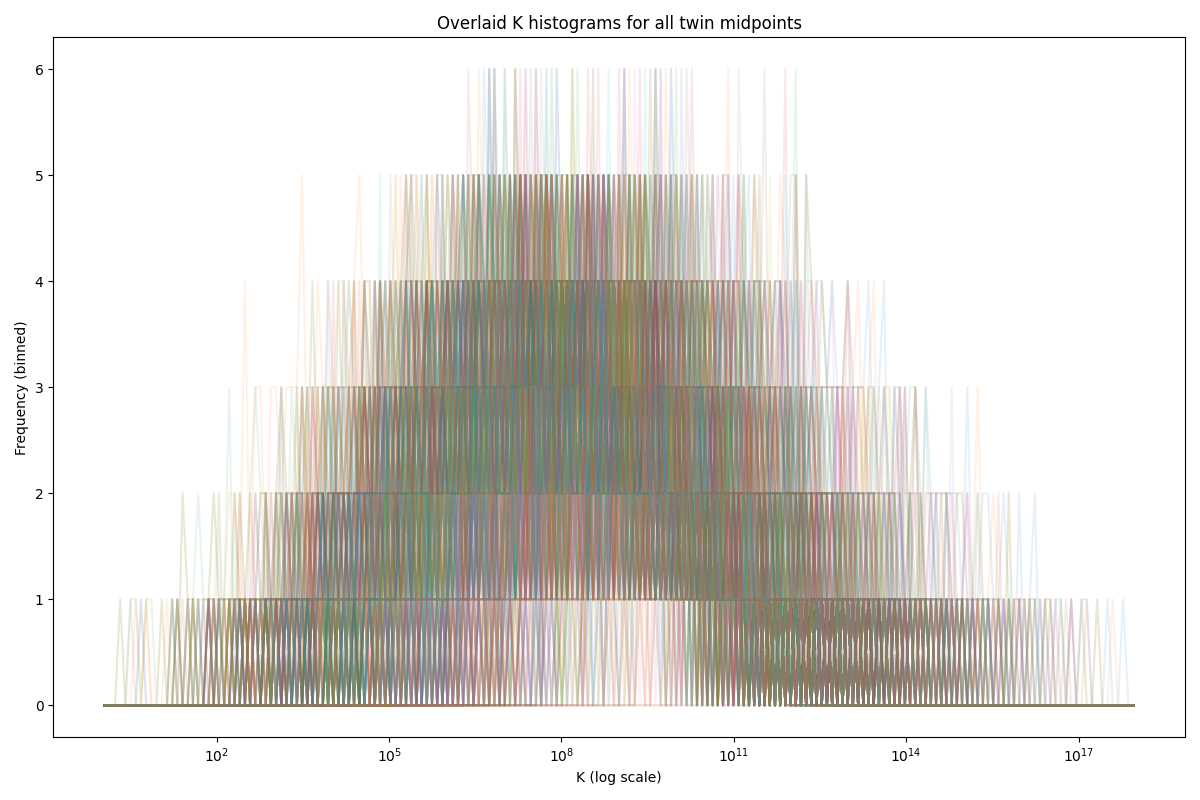
Overlapping Histogram of K Values JS20
This is an overlapping histogram of "K" values, which are field parameters specific to individual groups or classes of twin prime pairs. Here we can see a distinct Moire pattern form from the overlapping class histograms.
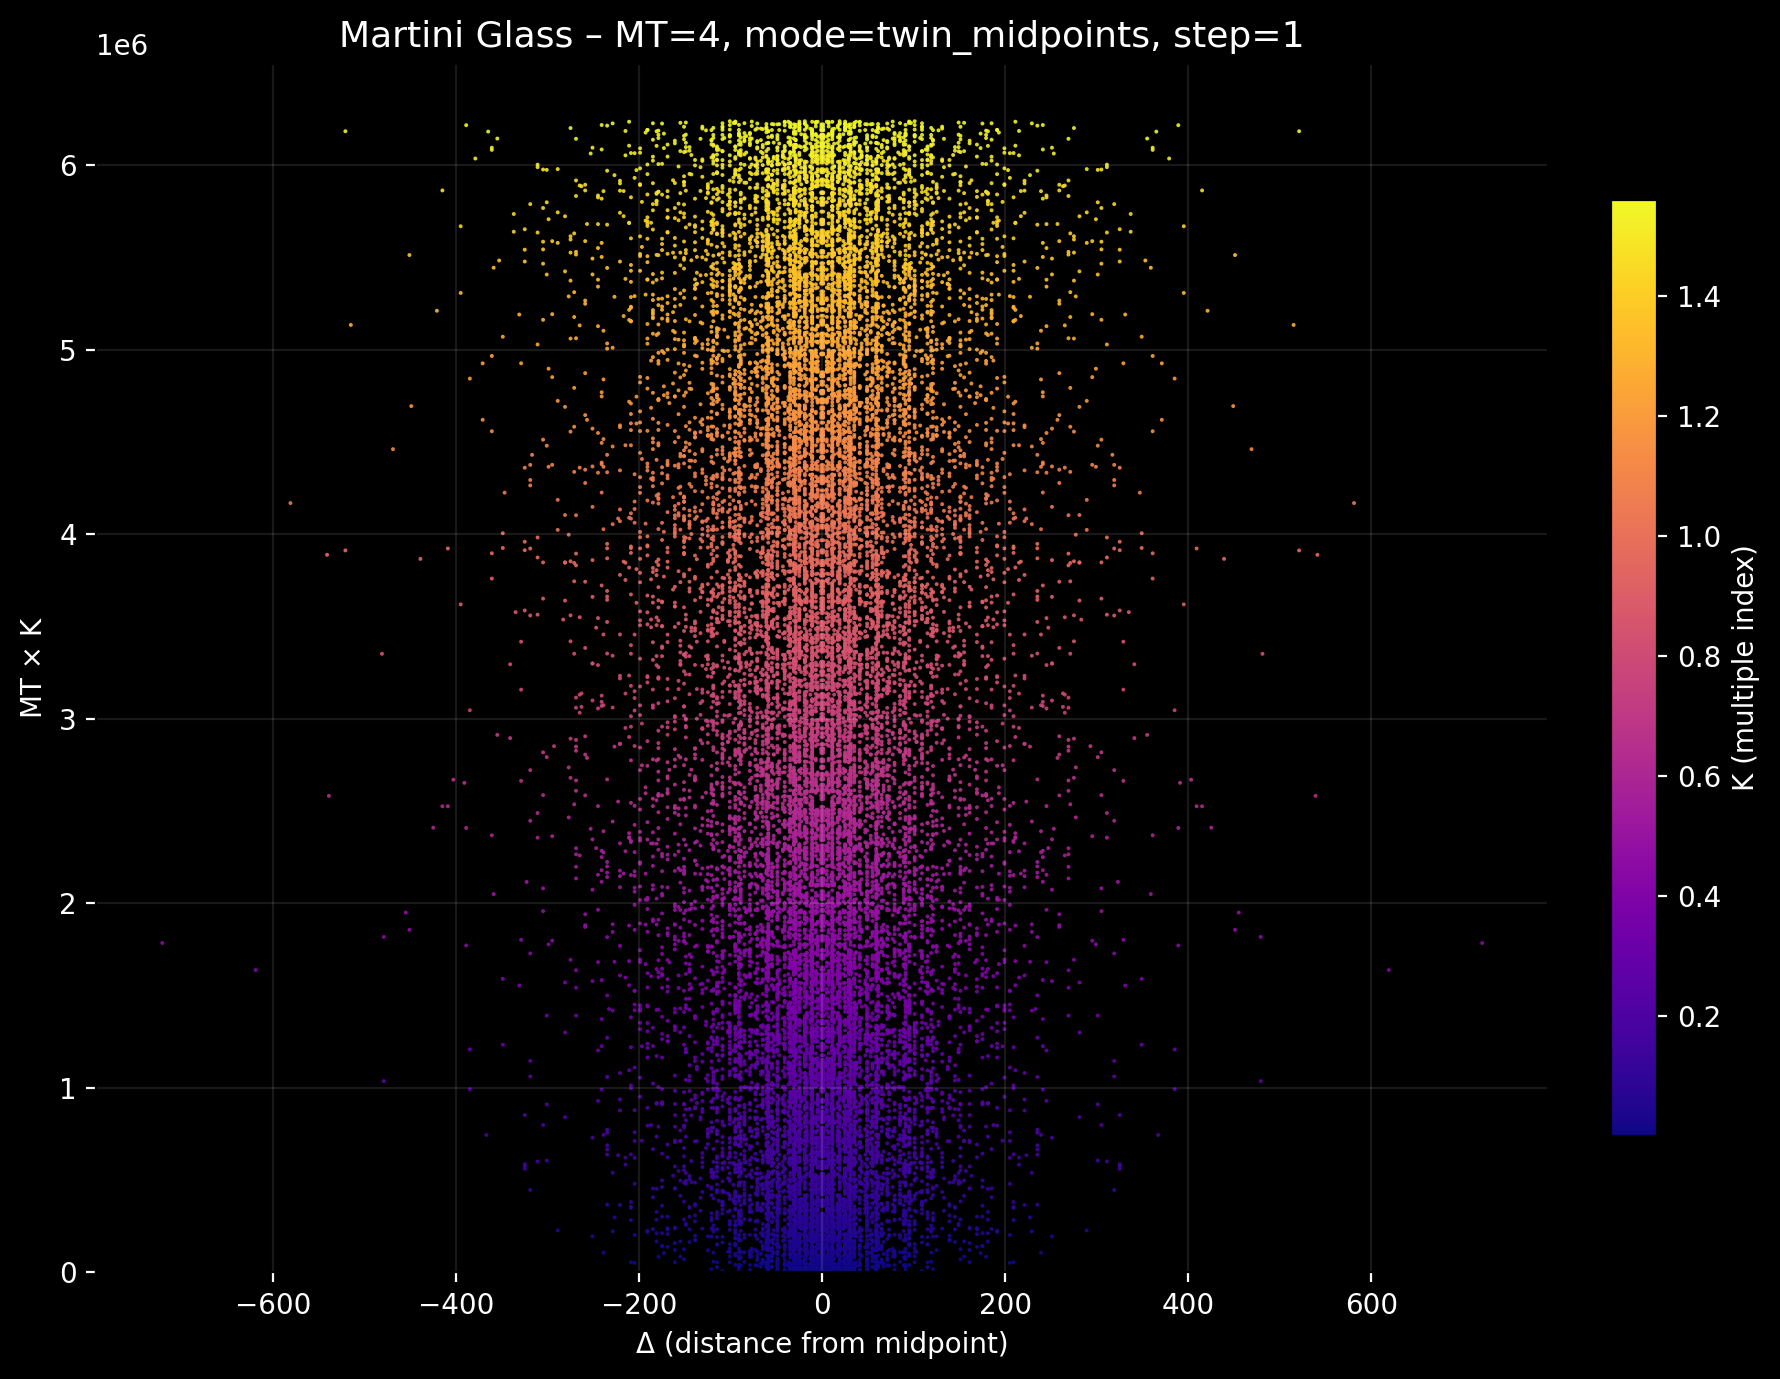
Martini Midpoints derived from twin prime pair (3,5)(Mollweide Projection)
Martini Midpoints derived from twin prime pair (3,5)
A plot of "Martini" midpoints derived from the twin prime pair (3,5) - see the faces, columns and curves which emerge from the mathematically precise plot.
Flythrough Video
Fly through video of a prime field. Each constellation of points represents an array of prime numbers
assembled within this field "prime crystal" which has been grown under strict software propagation rules.
Space Invaders Twin Prime Midpoints
Watch twin midpoints (p1-p2 = 2) assemble in shell 17 of a prime field. The twin prime numbers group and
hold position in a fixed structure in the sky before they break ranks and move on, see also the delta 4 and delta 6 videos of the same field.
Space Invaders Delta 4 Prime Midpoints
Watch as delta 4 prime midpoints (p1-p2 = 4) assemble in shell 17 of a prime field. The numbers assemble and
hold position in a fixed structure in the sky before they break ranks and move on, see also the twin prime and delta 6 videos of the same field.
Space Invaders Delta 6 Prime Midpoints
Watch as we focus this time on the delta 6 prime midpoints (p1-p2 = 6) assembling in shell 17 of a prime field. Again the numbers assemble and
hold position in a fixed structure in the sky before they break ranks and move on, see also the twin prime and delta 4 videos of the same field.
Martini Midpoint Plot
Here is an animation showing the progression of symmetric Martini midpoints - the vertical axis is centred on the Martini midpoint with each of the prime pair sitting either side. Each midpoint is exactly divisible by a twin prime midpoint.
Interactive 3D
Interactive 3D field visualisations are in development.